Basic Idea: <Back to top>
- The TOFp and TOFr Match & Ntuple Makers produce 'Match
Trees' that contain the event, track, and raw TOF information for all of the primary
tracks matching to singly- struck TOF cells.
This gives us TOF PID w.r.t. axes defined by the highest-pT
track in each event. Does the local hadrochemical composition change depending on whether
the TOF acceptance is "in" the "jet", on the opposite side as the "jet", or somewhere in
between? In central full-energy Au+Au, there apparently isn't an
away-side "jet". Is the hadrochemical composition on the away side the same as everywhere
else in the acceptance, or is there some modification there?
The very large event samples taken in Run-4 allow such an
analysis for the first time. The TOF system collected ~50M events at 200 GeV and ~11M
events at 62 GeV.
- In the same jobs that produce the match trees, I loop over
all primary tracks in the event and locate the track with the highest transverse momentum.
This track must also have -1.2< eta<1.2, Nfitpoints>15, and pT<20 GeV/c. The pX, pY, pZ,
and TrackId values for this track in this event are saved into the same match tree.
- These TTrees undergo offline timing calibrations which
produce calibrated 1/beta values, hence TOF PID, for each of the matched primary TOF
tracks.
- For each matched and calibrated TOF track, observables such
as delta-eta, delta-phi, and opening angle are defined using the momentum components
of the TOF track(s) and the highest-pT track in each event.
- then TOF observables such as pi/K, K/p, p-/p+ etc etc are
plotted versus delta-eta, delta-phi, and opening angle...
	Details on the data sets:

	62 GeV Data....
		Library version SL04f
		25,621 DAQ files processed (∼100%)
		6,348,019 total TPC-TOF track matches
		3,534,521 events with ≥1 TPC-TOF match
	200 GeV Data...
		(not available just yet)
Status:
1. Extrapolation Problem <Back to top>
A bug was found in the first processing of the 62 GeV data. Tracks pointing in a direction opposite to TOFp were still getting matched to TOFp slats. These bad matches were about 9% of the total matches and are completely nonsense. Xin Dong suggested the fix, which eliminated this effect.


On the left is pt vs. px for all TOFp matches. The two bands extending upwards w/ increasing pt are the real matches, the other two bands are the nonsense matches. On the right is eta vs. zvtx for all TOFp matches, the lower diamond are the real matches, the upper one is the nonsense matches. After the fix, the nonsense matches are all gone.
2. Low-Pt Match Problem <Back to top>
Less than 1% of the TOF matches have phi and pT values that do not make complete sense.


On the left is the azimuthal angle (in radians) defined by the momentum components at the primary vertex of tracks that are matched to TOFp. The two strong banana bands are sensible matches. The entries in between these bands are not. There is at present no explanation for these matches but we are still looking into it. For now this ~1% of the matches with inconsistend phi and pT values are simply cut away. This cut is done as shown above on the right, where this phi variable is centered around 0 then absolute-valued, and then plotted versus 1/pt. If a match has phi and pt values such that the entry on the right is below either cut line, the match is rejected.


3. X-Axes <Back to top>
The distributions of the various observables intended to be the X-axes in the present analysis are now described. We start w/ the distributions related to the highest-pT particle in the event.
On the left(right) is the pseudorapidity(azimuthal angle) of the highest pT
particle in each event.


The transverse momentum of the highest pT particle in each event. This variable
is referred to as HM0_pt in the following.

Now, the "X-axes" for this analysis are shown.
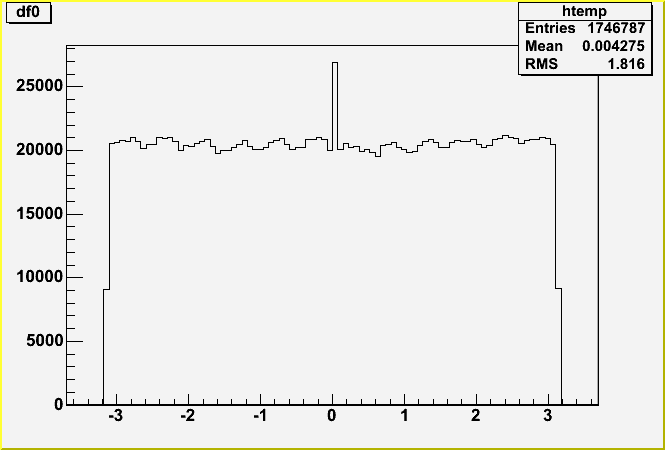
On the left(right) is the delta-eta(delta-phi) distribution where delta-eta
is defined as the eta of the highest-pT particle minus the eta of the TOF match.
The small spike at delta-eta=0 and at delta-phi=0 is real. This occurs when
the highest-pT particle in the event was also a TOFp match.


The opening angle between a TOF-matched track and the
highest-momentum track in the event. For opening angles near zero,
the TOF matches are near the "jet" axis (same-side) and for angles
near pi the TOF matches are near the away-side. The small spike at opening angle=0
is again from the case where a TOF-matched track was also the highest-pT particle
in the event.

4. TOF Timing Corrections <Back to top>
The inverse velocity vs the momentum following preliminary start- and stop-side
corrections.

The equivalent total timing resolution from the preliminary calibrations vs
the slat number.

The next plot shows the PID assignment based on the 1/beta values from TOFp.
The Z-axis is LogZ.
Upper left is dE/dx (in MeV) versus momentum for matches with 1/beta<1.04. The matches
inside the left triangle are called electrons. The other three frames show 1/beta minus
1/beta_expected for pions (upper right), Kaons (lower left), and protons (lower right).
The strong band for 1/beta minus 1/beta_expected near zero on the Y-axis are assigned
to be pions, Kaons, and protons, respectively.

5. Results <Back to top>
Centrality bins are based on refmult, using 0-10%, 10-20%, 20-40%, 40-80%, and else.
For RCP variables i add together the top two bins, so ratio is [0-20%]/([40-80%]*0.5).
