MRPC Dimension Analysis
Adam Meier and William Llope
MRPC Descriptions
Given below is the data acquired from a comparison of several different sets of MRPCs
for possible use in the TOFr detector for the STAR experiment. The MRPCs' physical dimensions were measured using rulers and calipers
and the data was input into an Excel spreadsheet . From the spreadsheet the data was exported into
a text file which was read into ROOT and used to analyze several physical parameters. These were used to determine whether the various MRPCs would fit into the trays of the detector.
By finding the
statistical variation in the modules already made, testing parameters can be specified to establish acceptable variation
in future MRPCs.
These MRPCs come from various sources and various previous experiments:
- 4 single stack CERN MRPCs made in 2001
- 10 single stack USTC MRPCs made in 2001
- 5 single stack USTC MRPCs made in 2002
- 20 new double stack USTC MRPCs made in 2004
- 26 single stack Tsinghua MRPCs made in 2004
- 5 single stack USTC MRPCs of label series 03

Fig. 1: Diagram defining the different measurements discussed throughout this page. (eps)
For all of the MRPCs, spatial dimensions are given with the module's labeling facing the viewer as shown in Figure 1. Design specifications for these measurements are found in the following references:
- TOF Proposal (5/24/04) Fig. 23. (Complete Specifications)
- Wang Yi, et. al., NIM A, 537,698 (2004) Fig. 1 (Length Only)
- Y.E. Zhao, et. al., NIM A, 547, 334 (2005) Fig. 1 (Length Only)
- Length refers to the longest (left to right) dimension and was measured with a ruler giving an expected error of +/- .02 inches. The Tsinghua measurements were taken by a different group with some other apparatus. Original specifications for the MRPCs given in the TOF proposal and the NIM Wang paper both suggest that they should have a length of 8.268 inches while the NIM Zhao paper shows a specification of 8.35 inches due to some Mylar that extends beyond the PCB.
- Height refers to the shortest (top to bottom) dimension and was measured with calipers giving an
expected error of +/- .001 inches. Heights were measured at each corner of the MRPC, as shown in Figure 1, and were combined to give an average height. The TOF proposal and NIM papers suggests that the single stack
MRPCs should have a height of .717 inches.
- MRPC Width refers to the second longest (up to down) dimension and was also measured with calipers giving an expected error
of +/- .001 inches. As shown in Figure 1, Width was measured at the left and right ends and also in the middle, for those MRPCs currently at Rice. No center width data is available for some of the Tsinghua modules. Using the data that was available, an average width was calculated for each MRPC. The TOF proposal and NIM papers show that the boards should have a width
of 3.701 inches.
- Height Difference refers to the difference between the height measured at one corner of a module and the average height for that module. Since there are 4 corner measurements for each MRPC, there are 4 height difference measurements as well.
- Width Difference refers to the difference between the left and right widths measured for each module. Width difference data is not available for some of the USTC 03 and 2001 modules.
- Skewness refers to the comparison of the differences between the left and center widths and the right and center widths. These two numbers indicate the degree to which the top and bottom boards are skew to each other.
- PCB Width refers to the width of one of the two or three individual circuit boards that make up each MRPC and was measured at the right side of the top and bottom boards. PCB width data is not available for some of the Tsinghua MRPCs. The PCB width should be the same as the overall width (3.701 inches) suggested in the proposals.
Figures 2 and 3 show the average lengths of the MRPCs measured with a ruler, as described above. The overall length range is significantly large, more than 100 mils, but this is only 1% of the proposed length. All of the MRPCs are longer than the 8.268 inches the TOF proposal suggests and closer to the specification of 8.35 inches made later in the NIM Zhao paper. Both specifications are indicated by arrows on the figures.
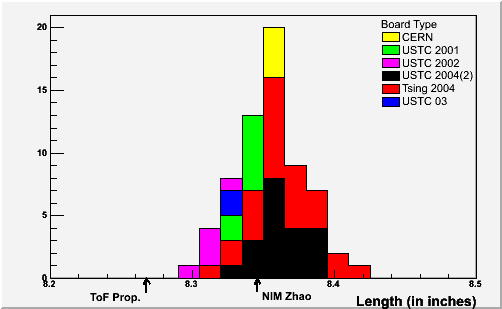
Fig. 2: The histogram of the lengths of the MRPCs. Arrows point to proposed lengths from [ToF Prop]/[NIM Wang] and [NIM Zhao].(eps)
The newer sets of MRPCs (Tsinghua 2004 and USTC 2004(2)) are slightly longer than the older types due to the extended Mylar on these modules. Between MRPCs of the same type, such as the Tsinghua modules, the standard deviation of the measurements is almost 25 mils, which is larger than the deviation of any of the other dimensions.
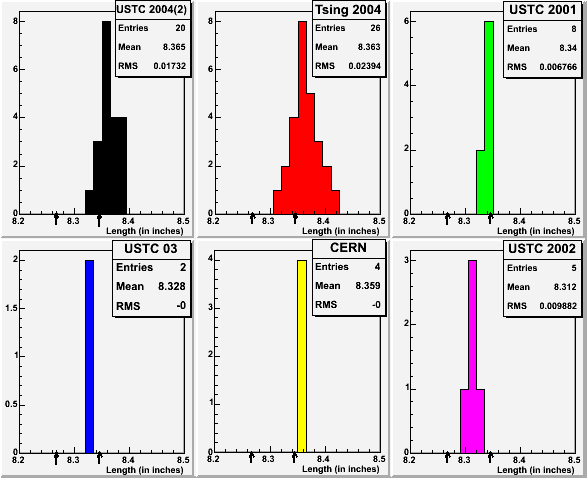
Fig. 3: Histograms of MRPC lengths separated by type. Arrows point to proposed lengths from [ToF Prop] and [NIM Zhao] as in Fig. 2.(eps)
Fig. 4 shows the mean and standard deviation of the length for each run with versus the production year. The mean plot gives an indication of the lengthening of the modules in 2004 due to the extra mylar, while the standard deviation plot shows how the added mylar, among other things, increases the variability in the lengths of the modules. The fit lines on each plot give some indication of these general trends.
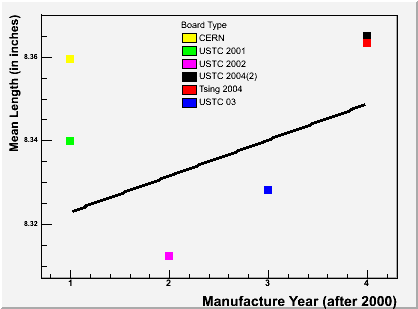
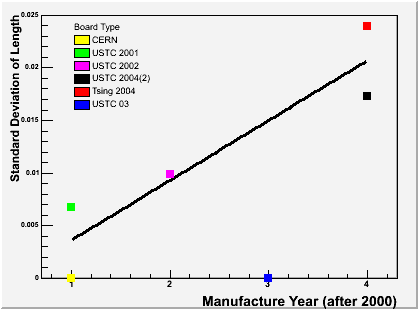
Fig. 4: Graphs of mean MRPC length and the standard deviation of MRPC length with versus production year. Lines indicate trends.(eps)(eps)
Figures 5 and 6 show the average heights of the MRPCs. The total range of 300 mils in the heights is quite high, almost 42% of the originally proposed height, reflecting the significant differences in manufacturing techniques between runs. The modules are mostly slightly taller than the .717 inches (shown as an arrow on the figures) suggested by the TOF proposal, but most were also made before that proposal was published.
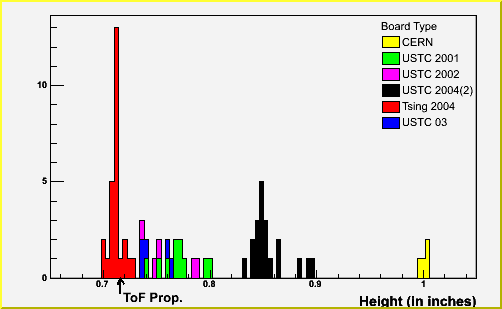
Fig 5: The histogram of the heights of the MRPCs. Arrow points to proposed height from [ToF Prop]. (eps)
Distinct differences are evident between the different production runs. The oldest CERN MRPCs are the tallest at a mean height of about an inch. The USTC single-stack MRPCs are about .76 inches tall on average. Created at about the same time as the ToF proposal, the Tsinghua single-stack MRPCs are the shortest at a mean height of .71 inches. Meanwhile, the double-stack MRPCs are taller at .85 inches. This reflects a general decrease in stack height, with the exception of the double stacks, which are understandably taller.
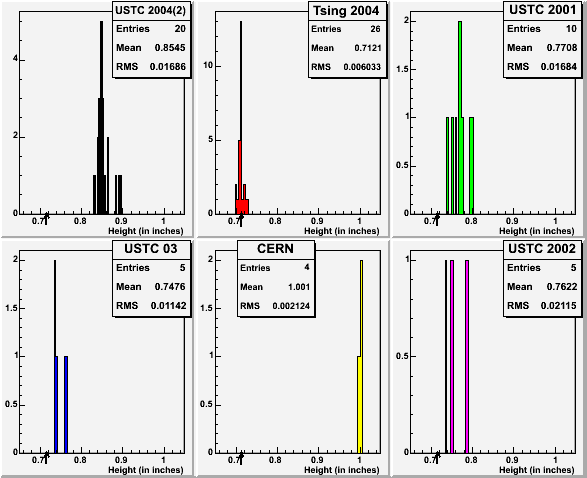
Fig 6: Histograms of the MRPC heights separated by type. Arrow points to proposed height from [ToF Prop] as in Fig. 4.(eps)
Fig. 7 shows the mean and stadard deviation of the height for each production type versus the year the MRPC. The trend line in the mean plot indicates the gradual decrease in height of the single stack modules, while the flat line in the standard deviation plot shows how the variability in height has not changed much with time. Within each production run, some of these standard deviations are quite large at around 17 mils, 2.4% of the average height.
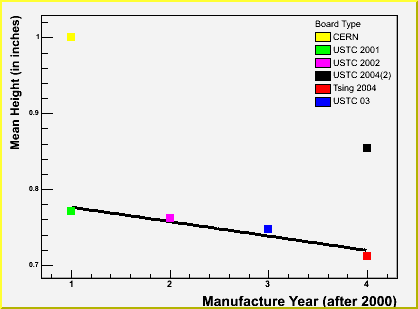
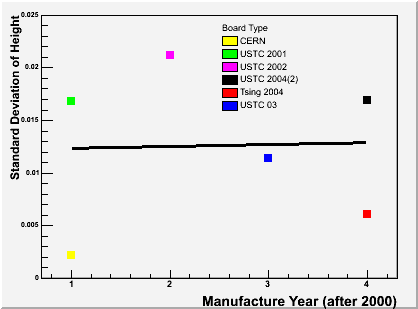
Fig 7: Graphs of the mean MRPC height and the standard deviation of MRPC height with respect to production year. Lines indicate trends.(eps)(eps)
Figures 8 and 9 show the average widths of the MRPCs. The MRPCs are fairly uniform in average width, with the 26 mil range being only .7% of the typical width. Unlike the other two dimensions, the width measurements are quite close to the 3.701 inch specification (shown as an arrow on the figures) given in the ToF proposal.
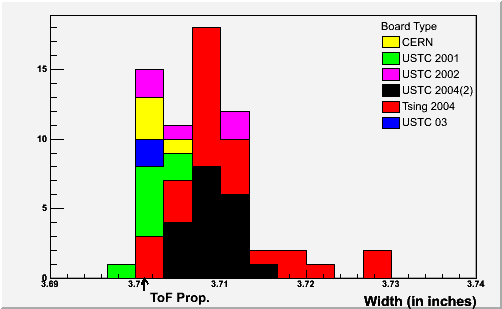
Fig. 8: The histogram of the widths of the MRPCs. Arrow indicates proposed width from [ToF Prop].(eps)
The newer modules (Tsinghua and USTC 2004(2)) are several mils wider on average than the older MRPCs. The standard deviation is low in general with the 6.9 mil standard deviation of the Tsinghua modules being the worst.
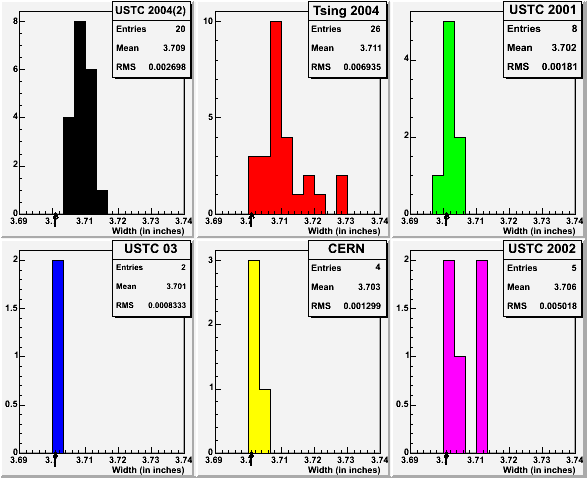
Fig. 9: Histograms of MRPC widths separated by type. Arrow indicates proposed width from [ToF Prop] as in Fig. 6.(eps)
Fig. 10 shows the mean and standard deviation of the width for each production run versus the production year. With the exception of the 2003 modules, the MRPCs have gradually grown in width, as indicated by the trend line in the mean graph. The trend line in the standard deviation plot reveals the variation in the single stack modules to be roughly constant.
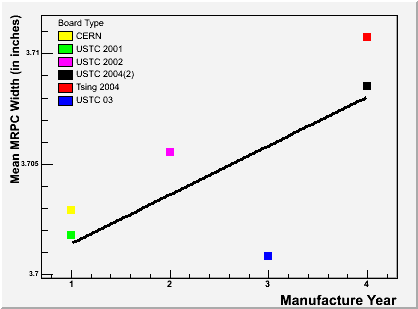
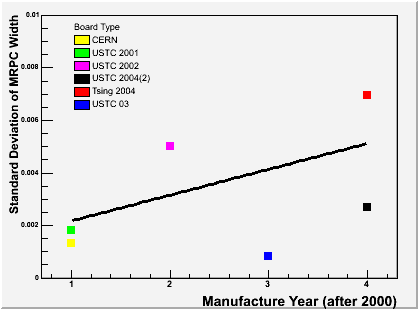
Fig. 10: Graphs of the mean and standard deviation of the MRPC width versus production year. Lines reflect trends. (eps)(eps)
Figures 11 and 12 show the differences between the mean height and the four corner heights for each MPRC. Large height differences indicate to some degree the uneveness with which the MRPCs are constructed and could suggest that the gas gaps inside the modules are uneven.
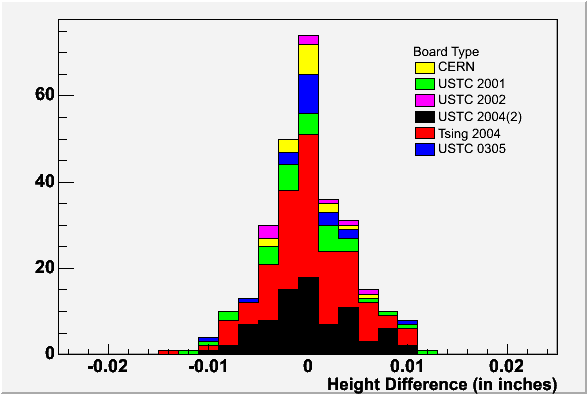
Fig 11: The histogram of the height differences of the MRPCs. (eps)
The average height difference is very close to 0 in each case, as should be expected given that the differences are taken between the each corner height and the average height of the module. The standard deviations for the production runs are all fairly close to one another.
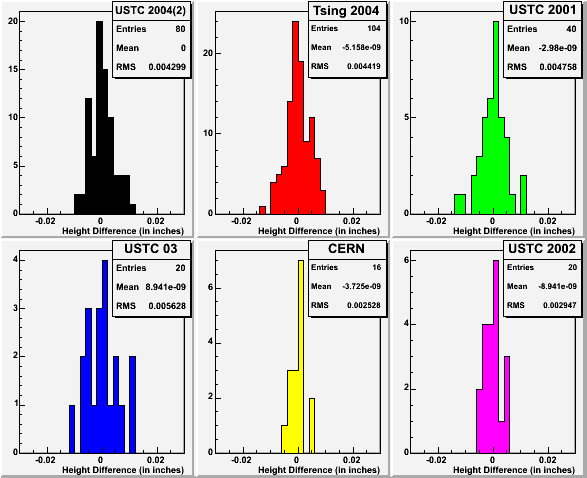
Fig 12: Histograms of the MRPC height differences separated by type. (eps)
Figure 13 shows the mean and standard deviation of the height differences for each production run versus the production year. In both cases the plots show no important variation.
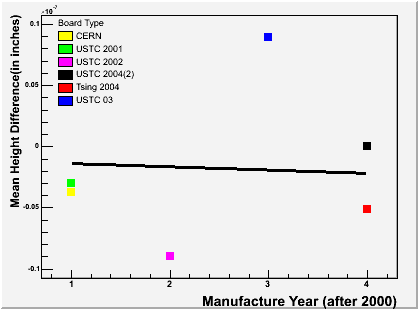
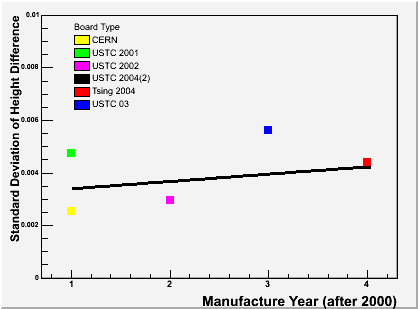
Fig 13: Graphs of the mean MRPC height difference and the standard deviation of MRPC height difference with respect to production year. Lines indicate trends.(eps)(eps)
Figures 14 and 15 show the differences between left and right widths for each module. Although the width differences have a large peak at zero, there are some outliers exhibiting a difference of more than 15 mils. These outliers either represent modules with top and bottom boards which are skew to each other or modules with unevenly cut PCBs as described in the PCB width section. MRPCs with large width differences would be harder to fit into a tray.
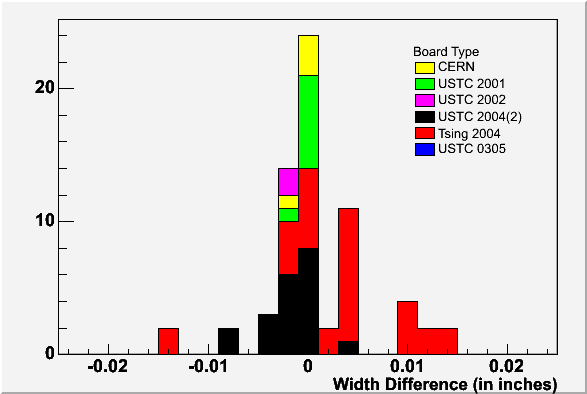
Fig 14: The histogram of the width differences of the MRPCs. (eps)
While the older 2001 modules appear fairly even (low width differences and low standard deviation), the newer modules, especially the Tsinghua modules, show significantly more variation.
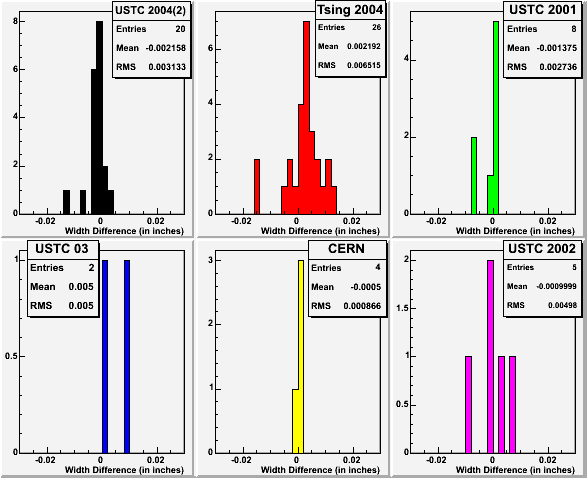
Fig 15: Histograms of width differences separated by type. (eps)
Figure 16 shows the mean and standard deviation of the width difference for each production type versus the production year. Although the standard deviation trend line is fairly flat, the width differences are increasing slightely for the newer MRPCs. The mean width difference should be zero in each case, since positive and negative width differences are equally likely.
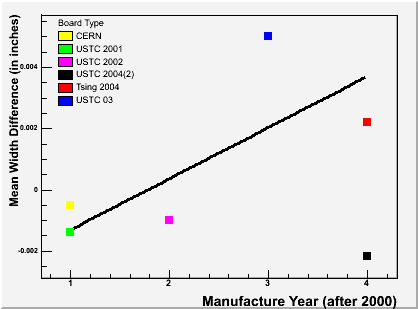
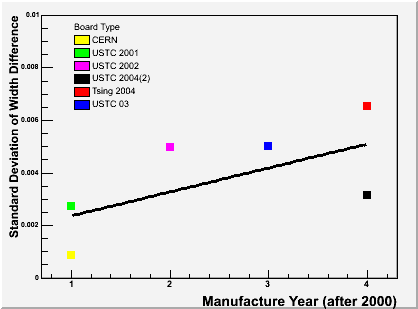
Fig 16: Graphs of the mean MRPC width difference and the standard deviation of MRPC width difference versus production year. LInes indicate trends. (eps)(eps)
Figure 17 attempts to show the degree to which the top and bottom boards of the
MRPCs are skew by plotting the difference between the left and center measurements versus the difference between the right and center
measurements. The points far from the center of the plot represent modulesss that are either twisted slightly in various ways as seen in Figure
16 or significantly uneven in width for some other reason. There seems to be a general trend toward modules lieing in the top right and left quadrants, and, while the greatest difference between left and right widths (edge width) is never more than about 15 mils, this skewness could still affect the way the modules fit into their rack.
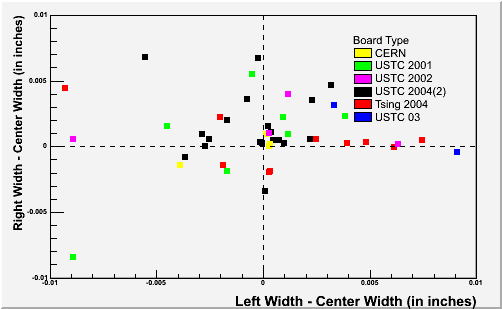
Fig 17: The plot of skewness of the top and bottom boards of the MRPCs. (eps)
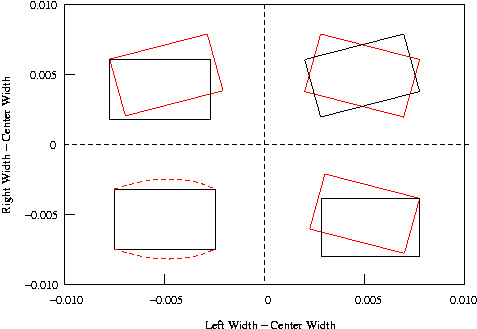
Fig 18: Graphical interpretation of the configurations of the boards in the different quadrants in Figure 12. (eps)
Figures 19 and 20 show the widths of the top and bottom circuit boards for each MRPC. The variation of PCB width, especially for the newer boards, reflects an uneveness in the way the circuit boards have been cut, and for some of the boards these jagged edges are actually visible. The average PCB width is still quite close to the proposed value (shown as an arrow in the figures). Variation in the MRPC width plot (Fig 8) can be seen as a combination of the skewness of the boards and the variation in the width of the PCBs themselves.
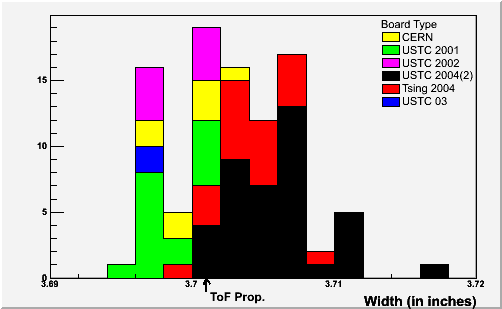
Fig. 19: The histogram of the widths of the PCBs. Arrow points to proposed width from [ToF Prop].(eps)
Fig 20 reveals that the newer modules have wider PCBs by an average of 5 mils. The USTC double-stack moduless also have the most significant distribution of PCB widths, representing unevenly cut boards.
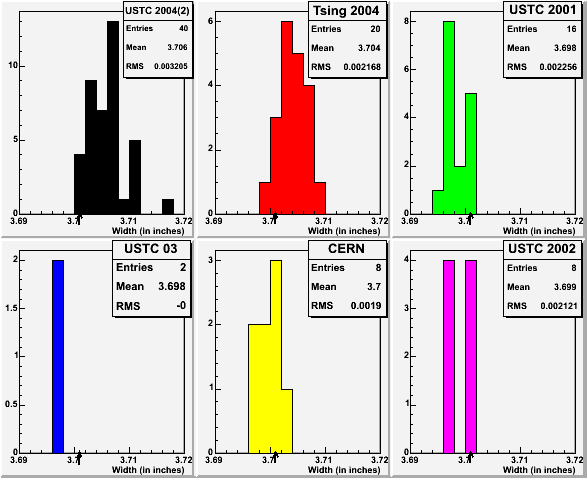
Fig. 20: Histograms of PCB widths separated by type. Arrow points to proposed width from [ToF Prop] as in Fig. 14.(eps)
Figure 21 shows the mean and standard deviation of the PCB widths for each production type versus production year. While the variation in PCB width is nearly constant for all boards, the trend line in the mean plot shows an increase in PCB width over time. This increase is reflected in the increase in MRPC width shown in Fig. 10.
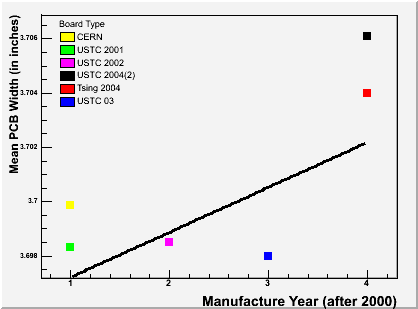
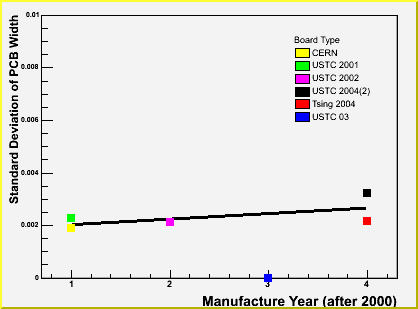
Fig. 21: Graphs of the mean and standard deviation of the PCB widths versus production year. Lines indicate trends. (eps) (eps)
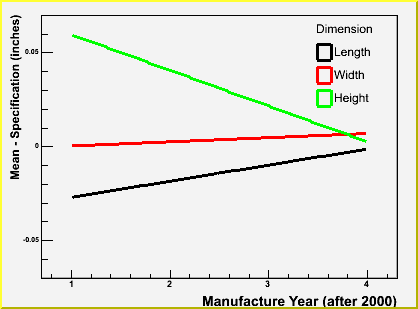
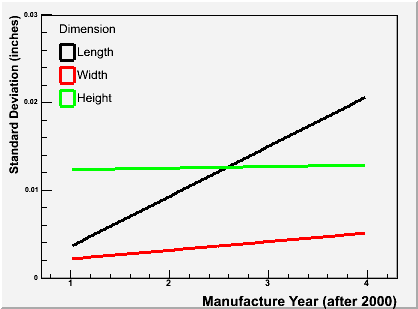
Fig. 22: Graphs of the trend lines for the three major module dimensions. Lines in the left plot have been normalized to zero by subtracting the specifications given by NIM Zhao (Length) and ToF Prop. (Width and Height).(eps)(eps)
Summary
The two plots in Figure 22 summarize the MRPC dimensions by showing on the same axis the change in mean and standard deviation for the three major dimensions over the last 4 years. For the mean plot, the lines were normalized by subtracting from each value the specification for the value given in NIM Zhao (Length) and ToF Prop (Width and Height). The length and height for the single stack modules are clearly converging on these specifications, while width seems to be increasing slightely with each new generation of MRPC. The 2004 double stack modules, which were not included in these trend lines, show a mean height of .85 inches but are otherwise fairly similar to the 2004 Tsinghua modules.
The standard deviations for the various dimensions also seem to be increasing in general. In the case of the width and length, this is largely due to the skewness of the newer boards, as shown in Figures 16 and 17. The length dimension is further complicated for the newer modules by the layer of Mylar which extends approximately 8 mils beyond the PCB and which is not as rigid. About half (2 mils) of the width variation is due to the width variation in the circuit boards themselves (Fig.21.).
The plots throughout this page (eg. Figure 8) make it fairly clear which modules are a statistical outliers and which are going to be difficult to fit into a stack. Similarly, using the general distributions of the histograms, it should be easy to set up acceptable standards of variation for future boards.


