|
|
|
|
| V (Volts) | I (Amps) | P (Watts) |
| +4.2 | 16 | 67 |
| +4.2 | 11 | 46 |
| -8.5 | 3 | 26 |
| (total) | 139ḟ10 |
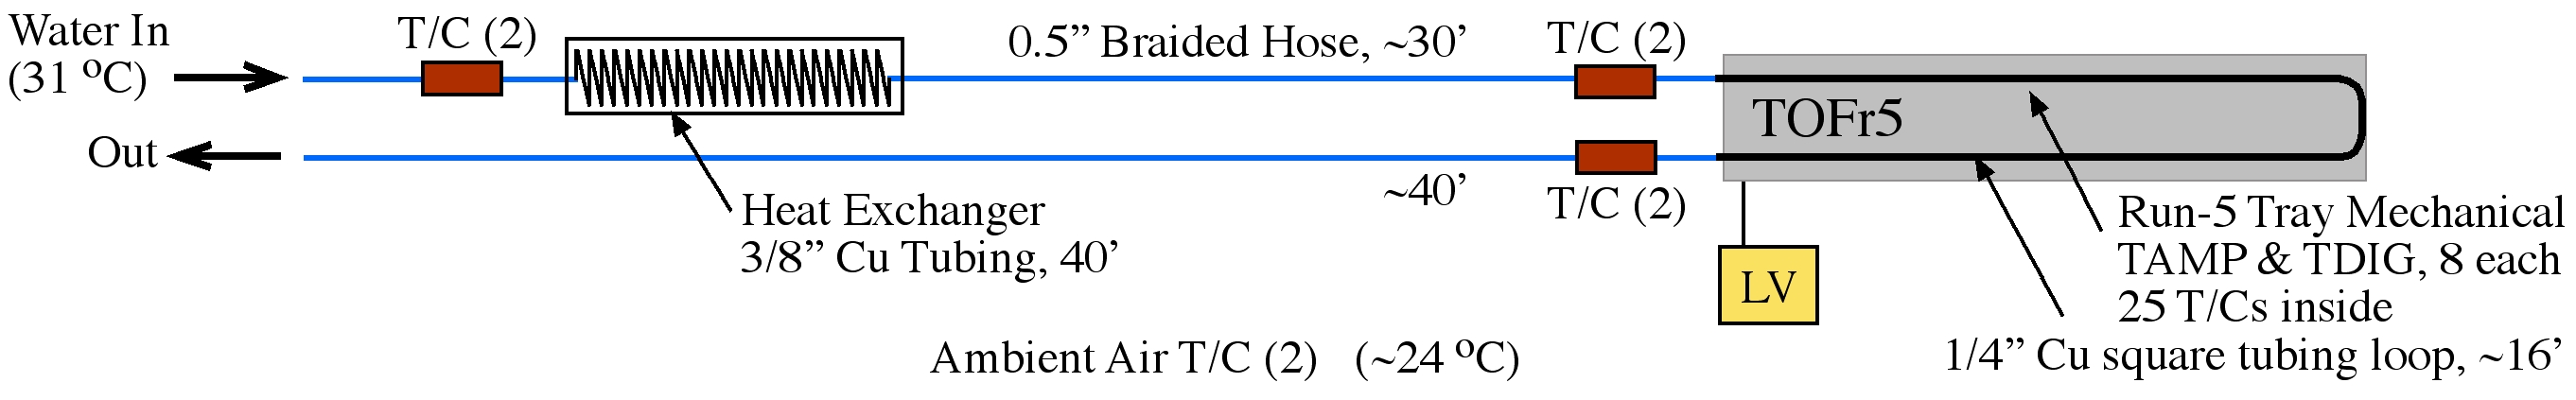
| T/C | Location | T/C | Location |
| 0 | Reference Inside KS1992 | 16 | TDIG Regulator pos6 |
| 1 | Tray Inside Air h ~ 0.2 | 17 | TDIG pcb near sensor pos4 |
| 2 | Tray Inside Air h ~ 0.5 | 18 | TDIG pcb near sensor pos4 |
| 3 | Tray Inside Air h ~ 0.8 | 19 | Air Gap Above TDIG pos1 |
| 4 | Tray Side Wall Inner h ~ 0.2 | 20 | Air Gap Above TDIG pos4 |
| 5 | Tray Side Wall Inner h ~ 0.2 | 21 | Air Gap Above TDIG pos6 |
| 6 | Under TAMP near sensor pos4 | 22 | TDIG pcb top pos0 |
| 7 | Under TAMP near sensor pos4 | 23 | TDIG pcb top pos7 |
| 8 | Air Gap Below TDIG pos1 | 24 | Lab Room Temperature |
| 9 | Air Gap Below TDIG pos4 | 25 | Lab Room Temperature |
| 10 | Air Gap Below TDIG pos6 | 26 | Water At Tray Input |
| 11 | HPTDC1 Chip pos6 | 27 | Water At Tray Input |
| 12 | HPTDC4 Chip pos6 | 28 | Water At Tray Output |
| 13 | HPTDC2 Chip pos6 | 29 | Water At Tray Output |
| 14 | HPTDC3 Chip pos6 | 30 | Water In |
| 15 | TDIG Altera Chip pos6 | 31 | Water In |
|
|
|
|
| (1) |
| (2) |
|
| (3) |
| (4) |
|
|
|