|
|
|
|
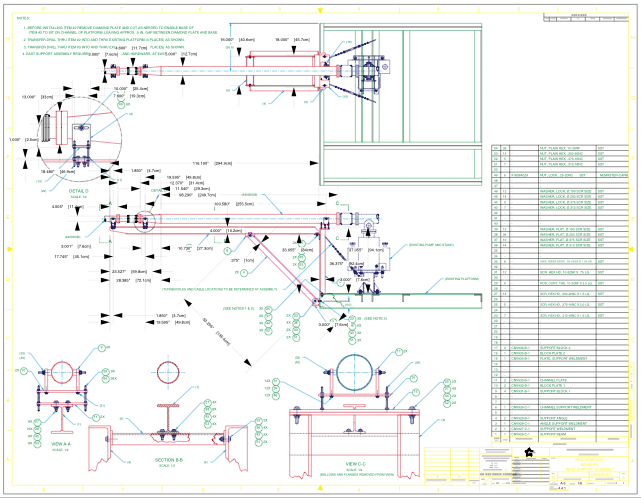
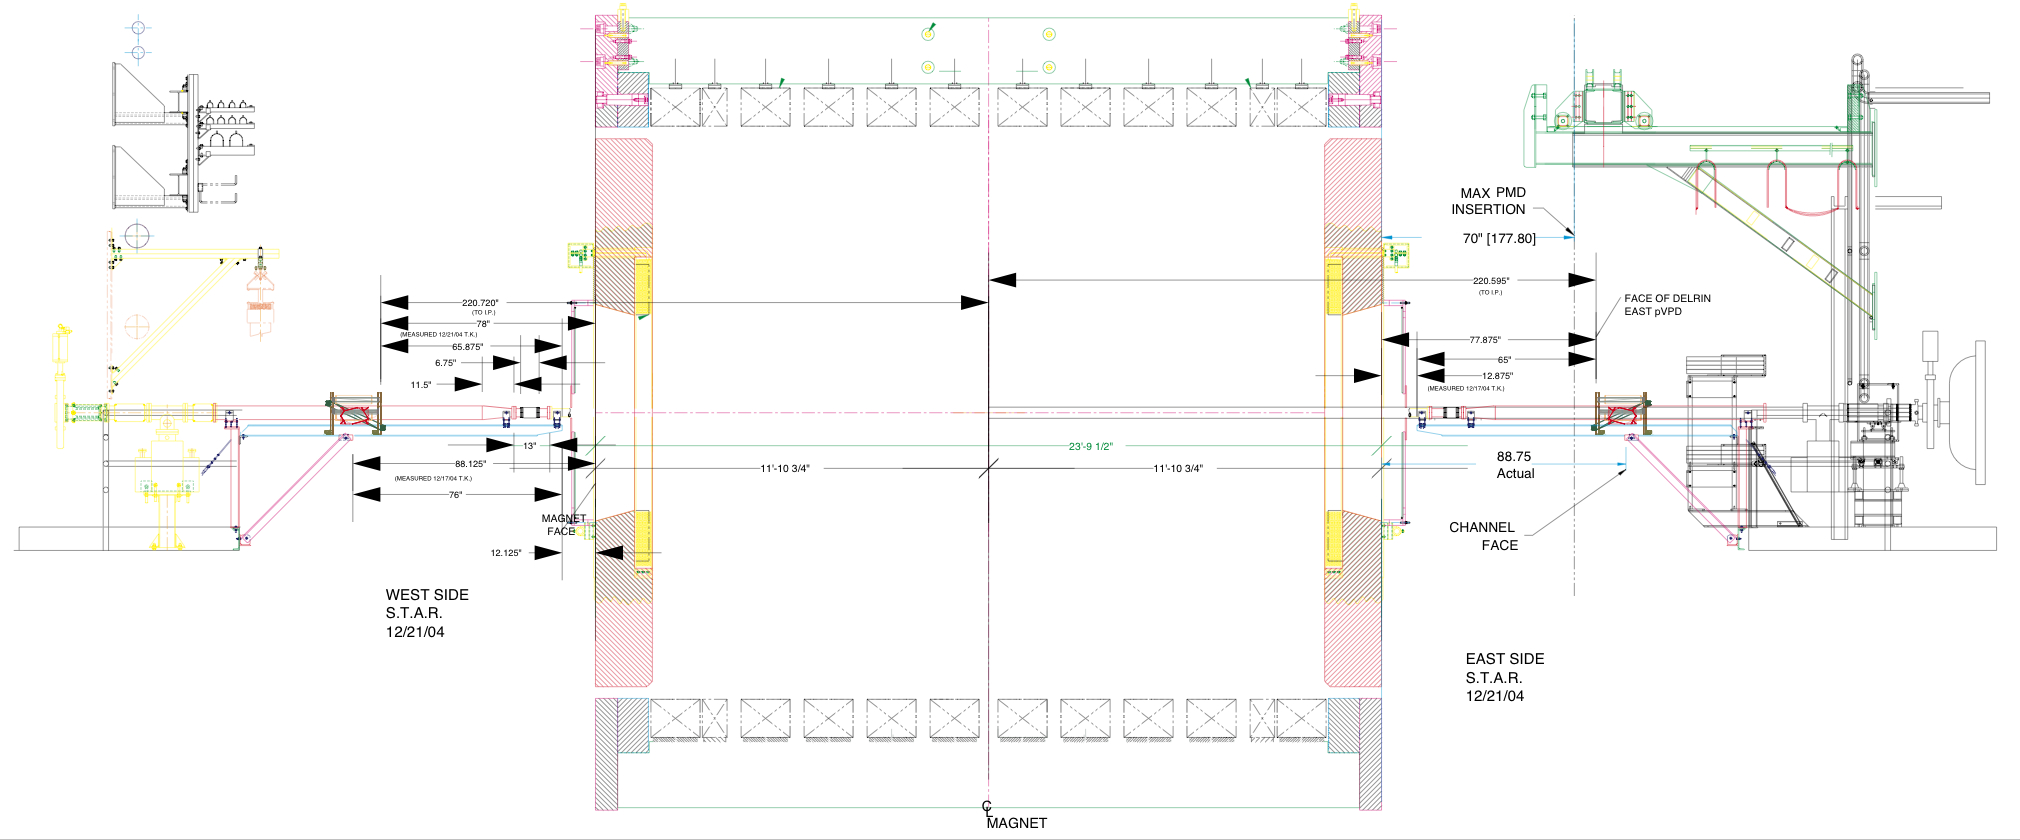
| Quantity | West | East |
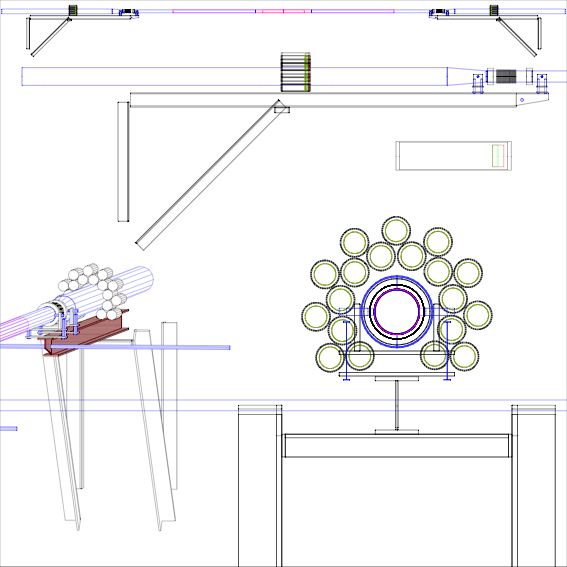
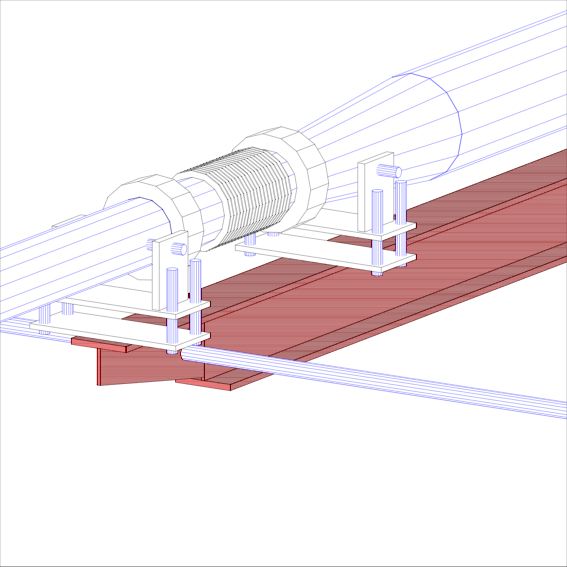
| DZ, magnet steel to start of I-beam f | 12 1/8" | 12 7/8" |
| DZ, magnet steel to pVPD front face | 78" | 77 7/8" |
| DZ, magnet steel to cross-piece | 88.125" | 88.26" |
| Z-extent, 3" pipe to 5" pipe neck-up | 10.69" | 10.54" |
| Z, pVPD front face | 220.72" | 220.59" |
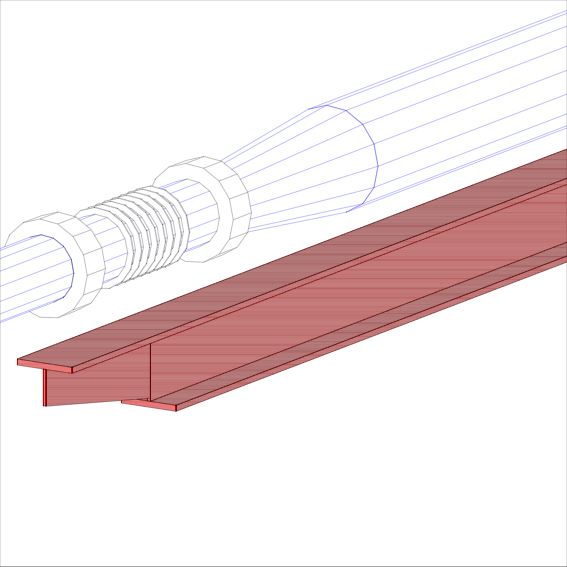
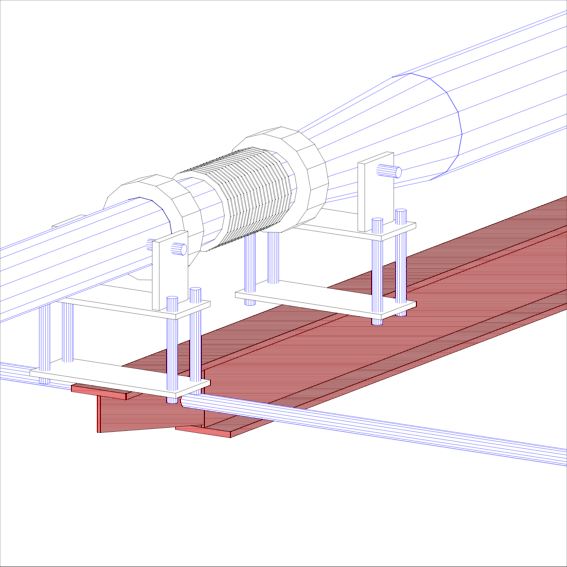
| DZ, start of I-beam to Z-center Bracket #1 | 1.85" | |
| DZ, start of I-beam to Z-center Flange #1 | 4.51" | |
| DZ, start of I-beam to Z-center Flange #2 | 12.37" | |
| DZ, Z-center Flange #2 to end of neck-up | 11.54" | |
| DZ, start of I-beam to Z-center Bracket #2 | 19.59" | |
| Z-extent, I-beam | 116.1" | |
|
|
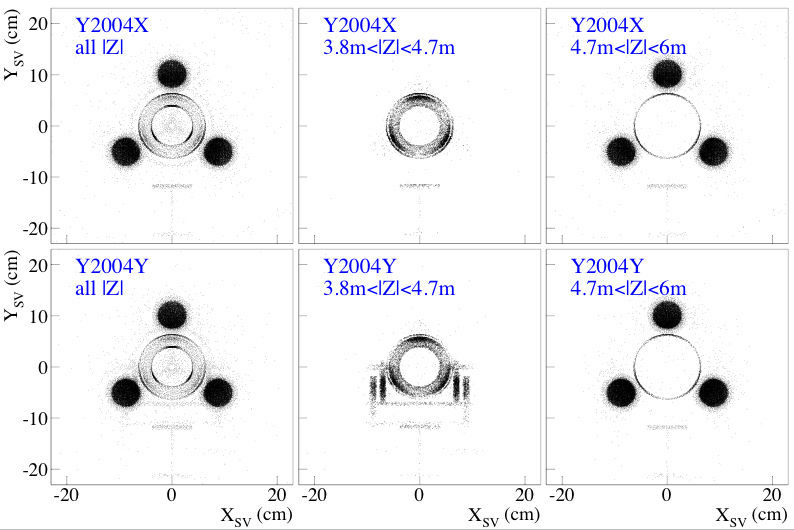
| Bank | Variable | Y2004X | Y2004Y | |D| |
| PIPG | S1Leng (cm) | 153.4 | 164.2 | 10.8 |
| S2Leng (cm) | 18.0 | 15.7 | 2.3 | |
| S3Leng (cm) | 1.0 | 0.5 | 0.5 | |
| ConeLen (cm) | 12.5 | 13.7 | 1.2 | |
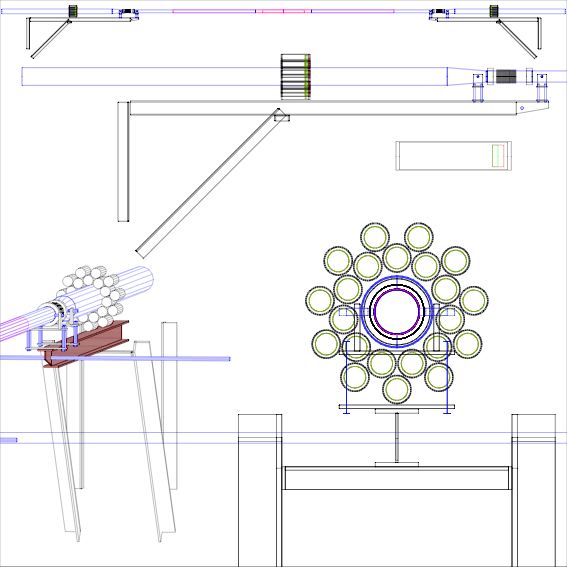
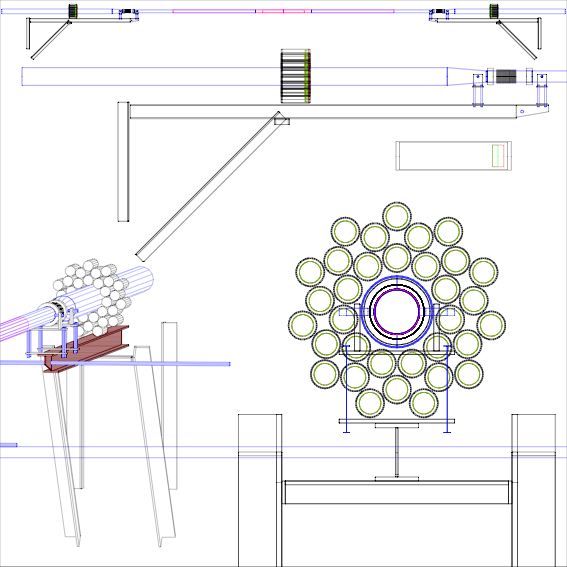
| RibNum | 8 | 20 | 12 | |
| RibCent (cm) | N/A | 5.0 | N/A |
| Bank | Variable | Y2004X | Y2004Y | |D| |
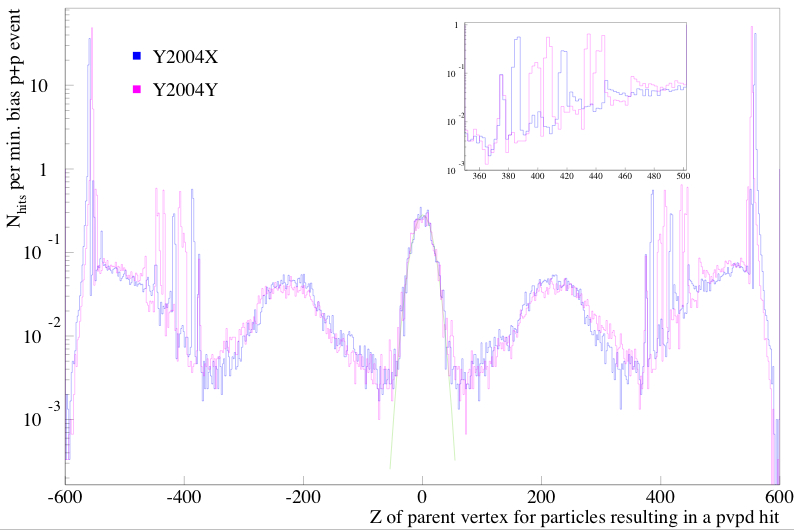
| VPDG | pVPD West Z | 573.57 | 568.1 | |
| pVPD East Z | -574.57 | 570.0 | ||
| I-Beam West Z | 530.48 | 540.45 | ||
| I-Beam East Z | 530.48 | -542.35 | ||
| BXthick | 0.635 | 0.127 |
| Run | In CVS: | Should be: | ||
| Zwest (cm) | Zeast (cm) | Zwest (cm) | Zeast (cm) | |
| 2 | 563.1688 | 561.2638 | 556.7 (est.) | 556.6 (est.) |
| 3 | 563.4069 | 564.4388 | 557.0 (est.) | 559.9 (est.) |
| 4 | 573.5669 | 574.5688 | 568.1 | 570.0 |
| 5 | N/A | N/A | 583.5 | 583.8 |
|
|
|
|
|


